Special Report
Failing To Make Ends Meet:
How Rising Health Care Costs Impact MA Residents
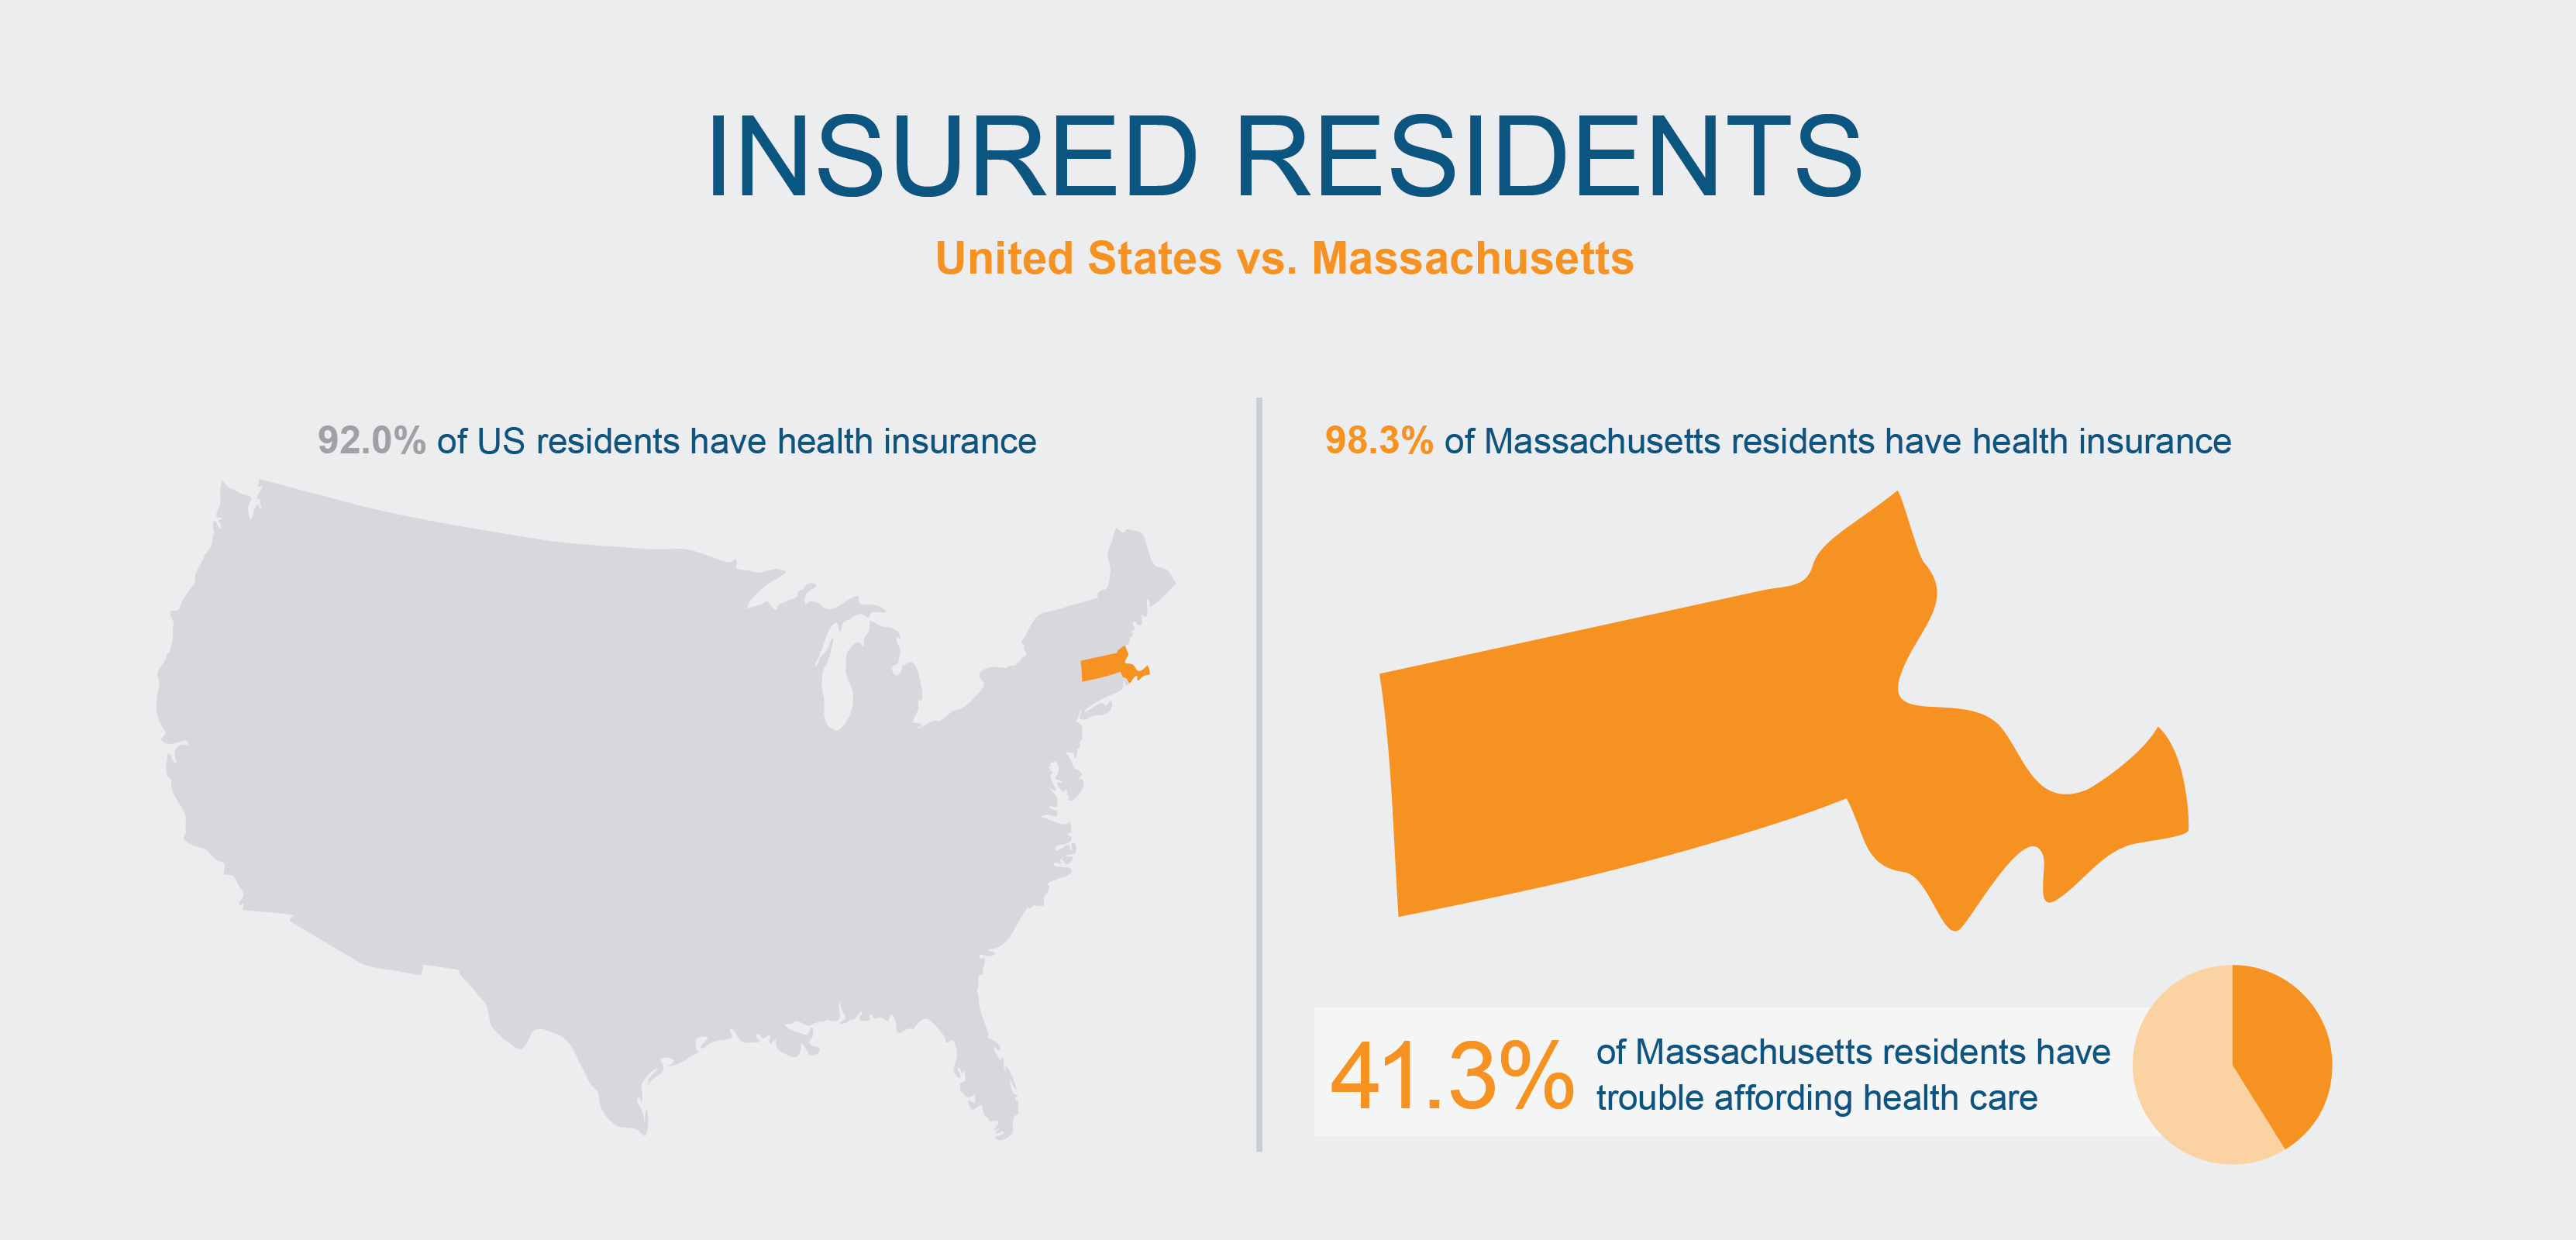
Massachusetts has the highest rate of insured residents in the United States. At the same time, it has some of the highest health care costs, with 41.3 percent of residents managing medical debt, skipping needed care because of cost, or experiencing other affordability issues.
In 2012, state leaders recognized these affordability issues and took steps to manage rising health care costs. The Commonwealth set an annual target—known as the health care cost growth benchmark—to keep the increase in health care costs in line with the overall economy. The benchmark was 3.6 percent for 2023.
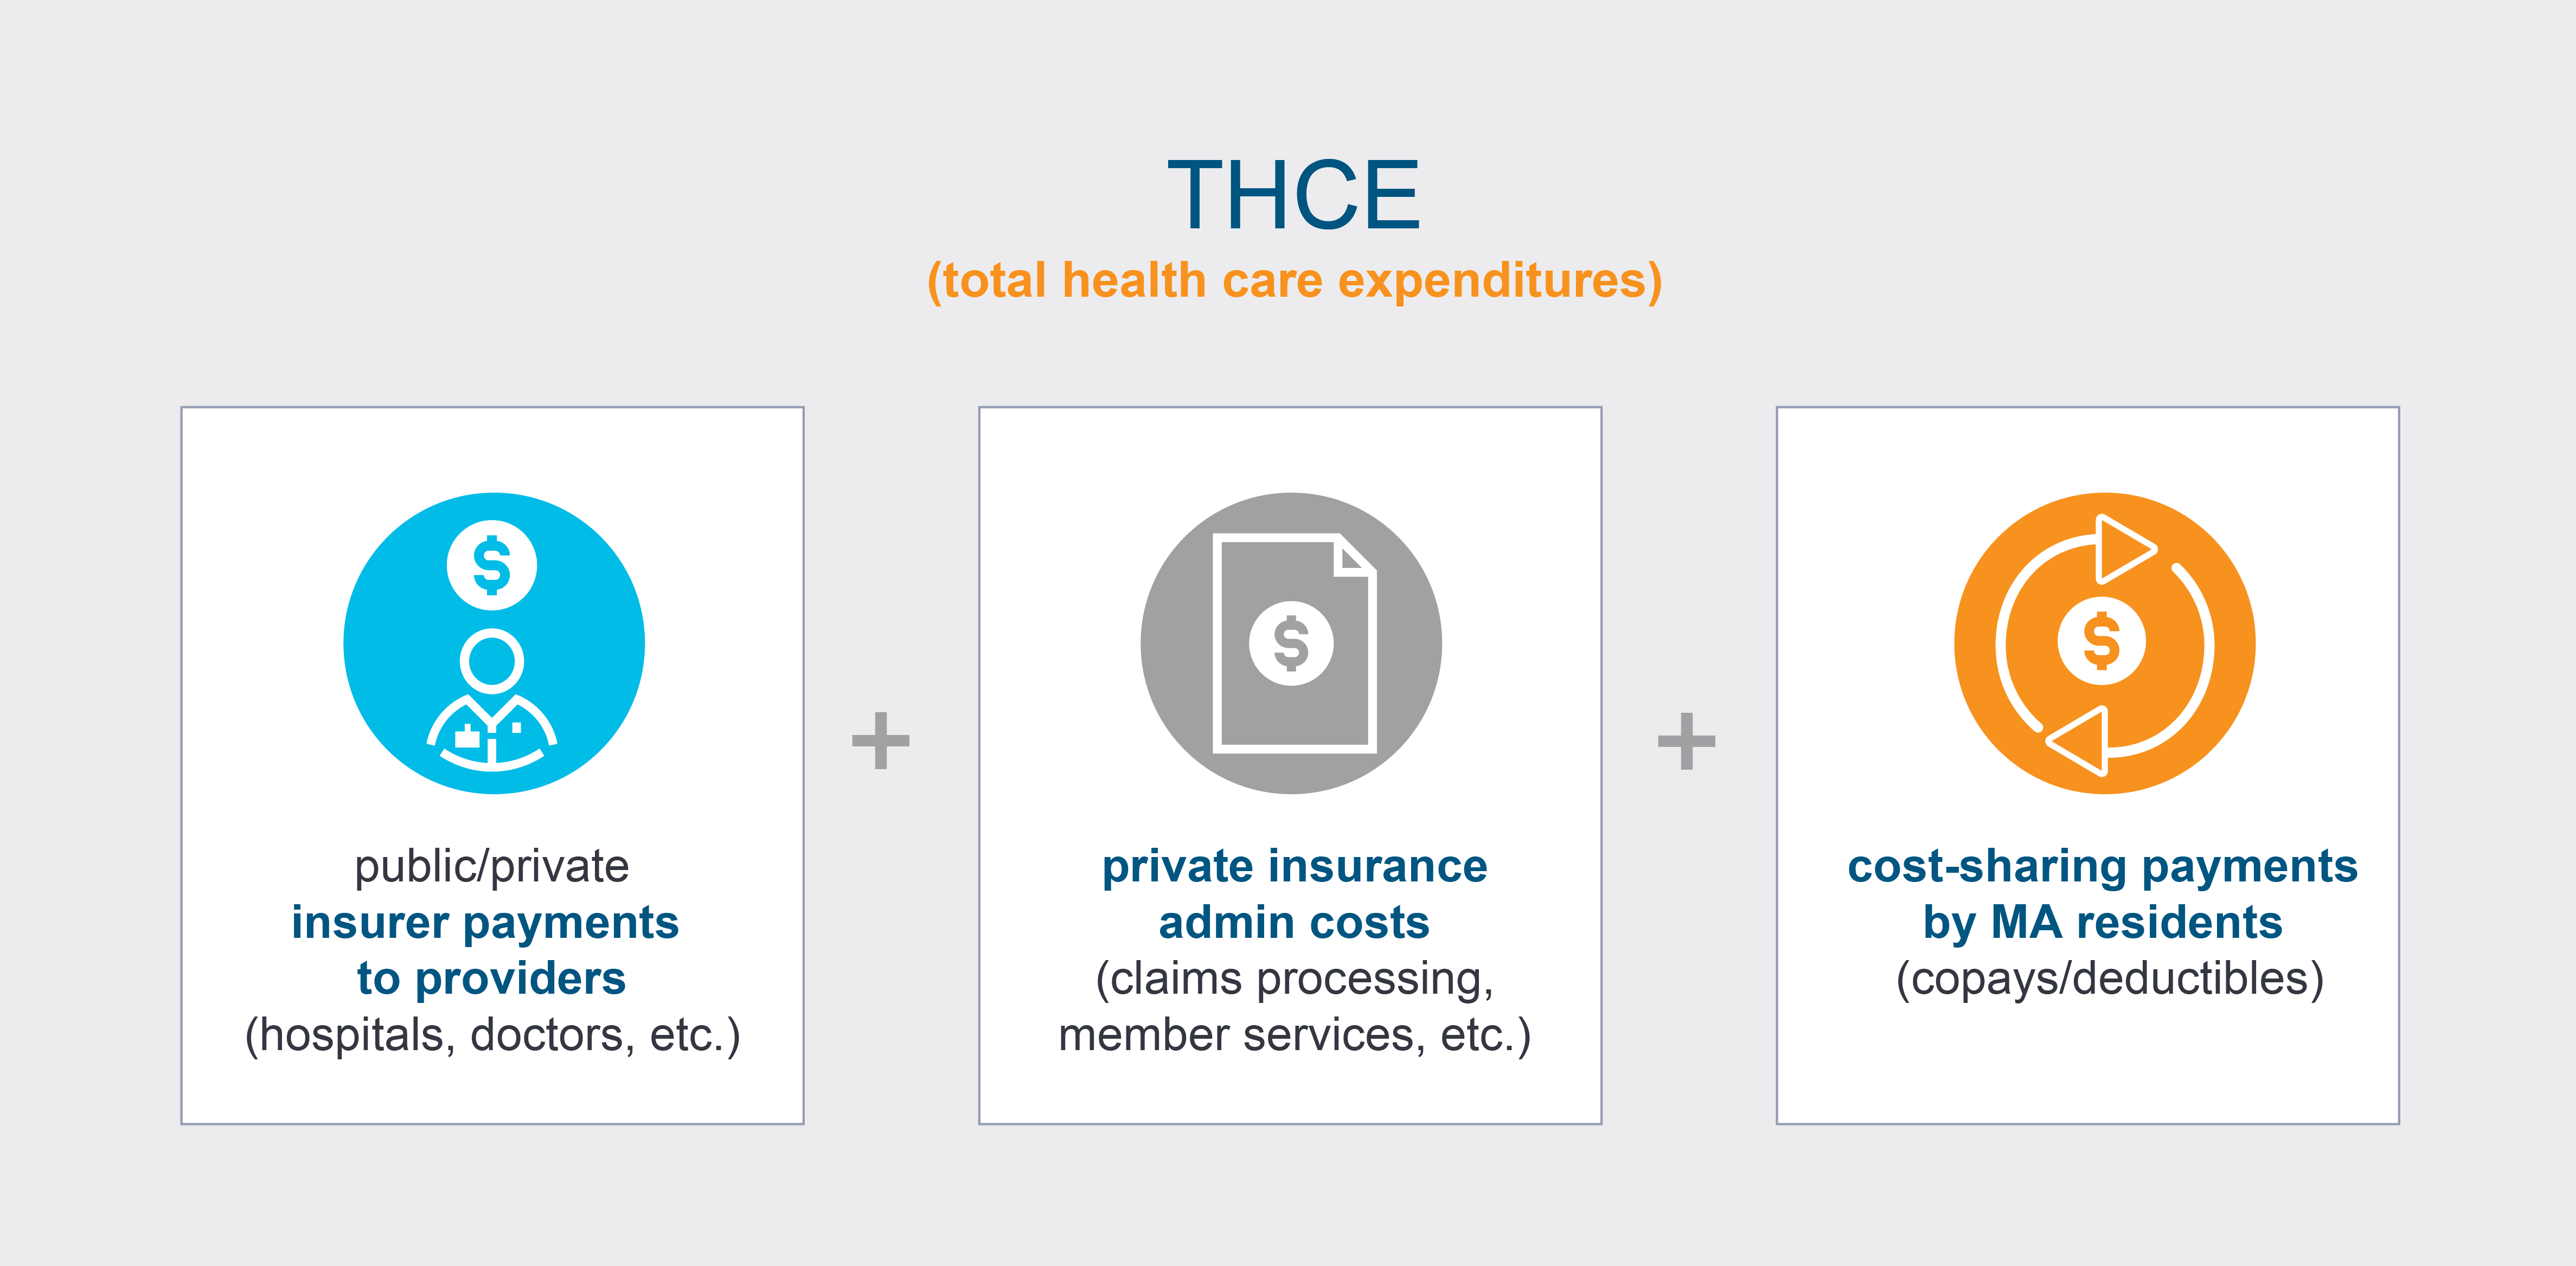
To monitor health care spending so that it could be compared with the benchmark, leaders also decided on a measure called THCE, or total health care expenditures.
THCE measures spending by the Massachusetts health care system. It’s a sum of three elements: the amount that insurers pay to providers, such as hospitals; the administrative costs for insurance, such as claims processing; and the amount paid by Massachusetts residents in copays and deductibles.
While THCE helps us look at costs to the health care system, this overall measure can mask the individual experiences of rising cost pressures felt by Massachusetts residents.
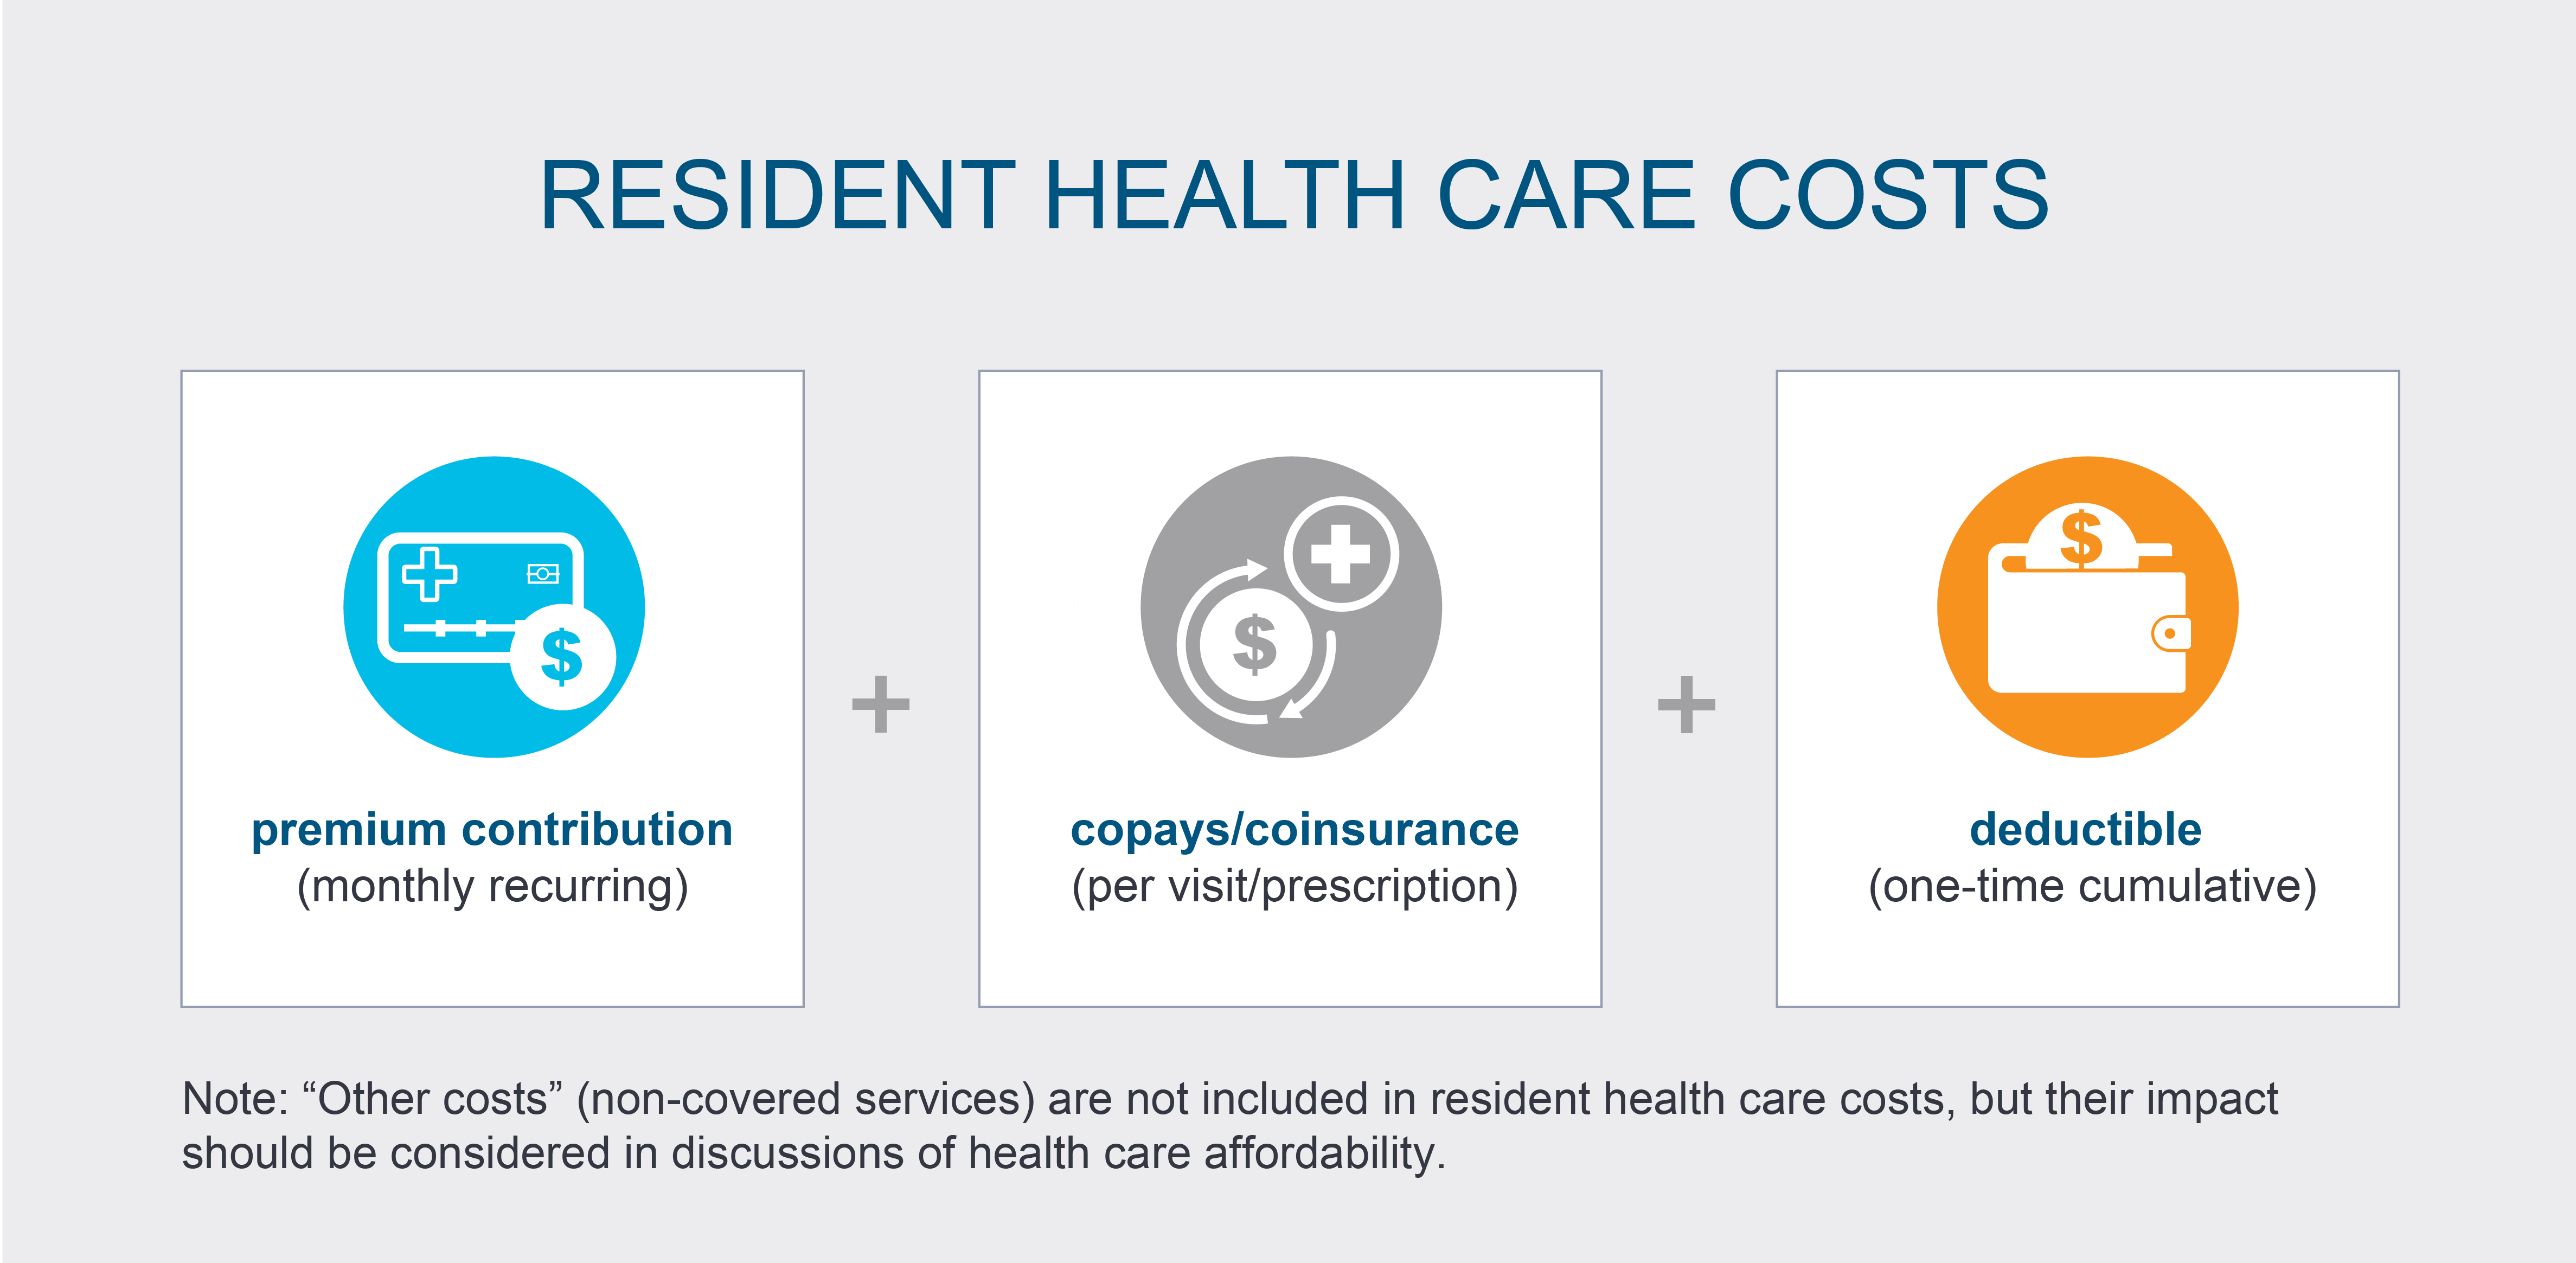
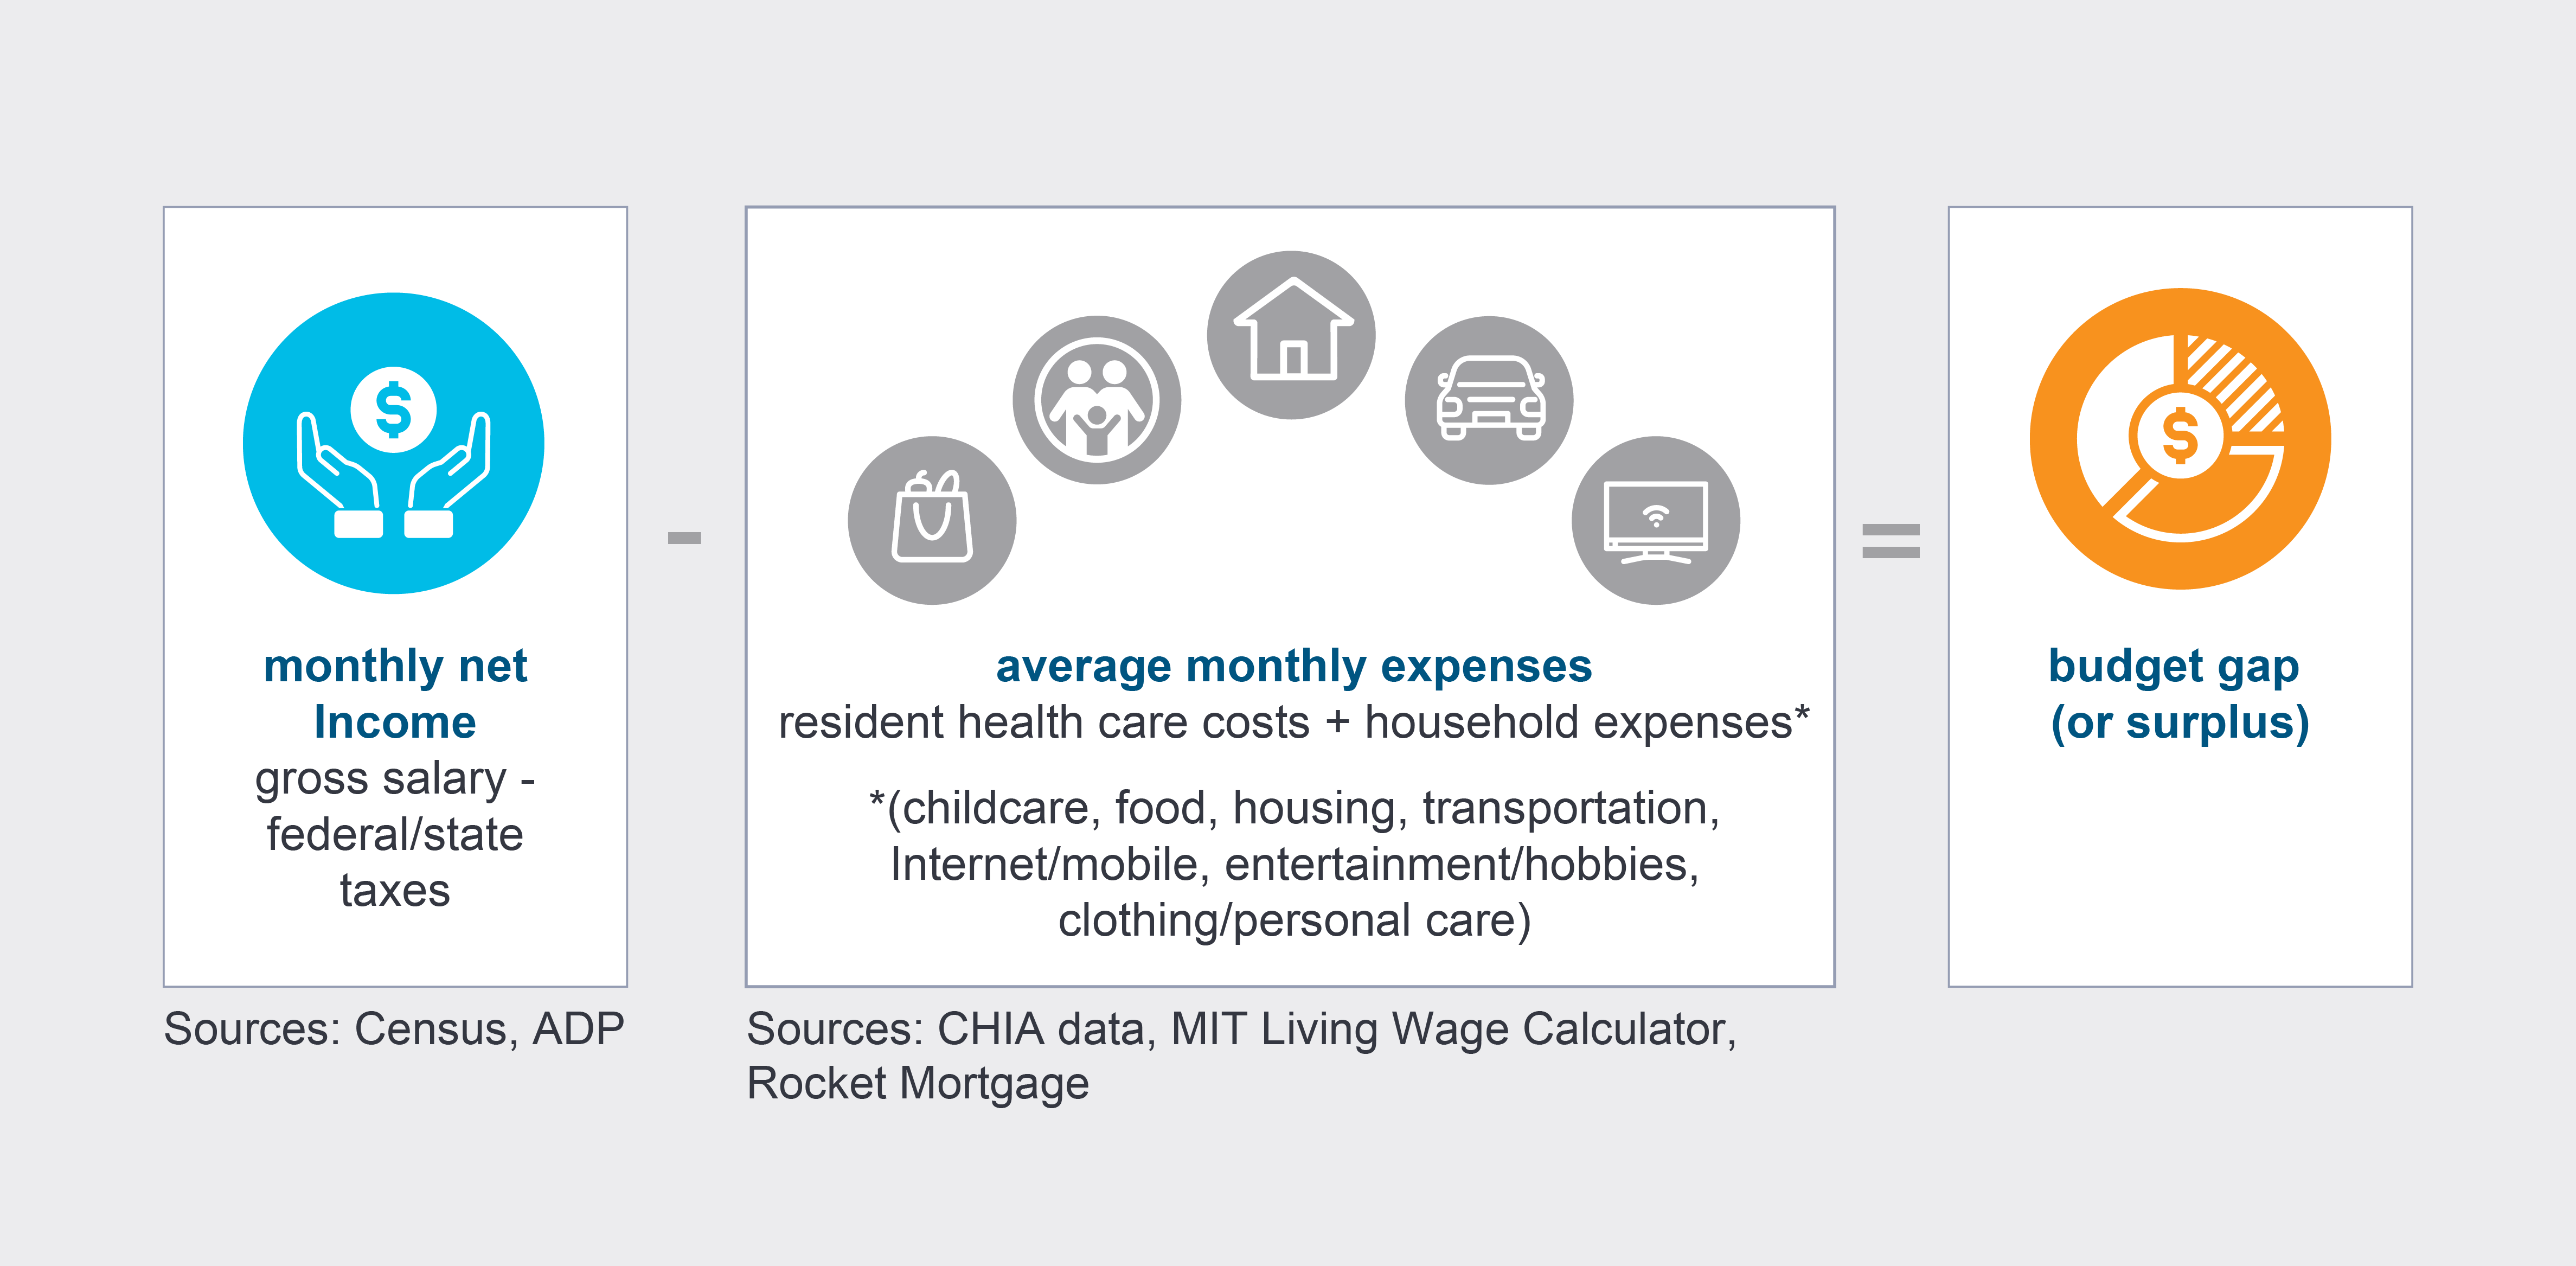
As residents, what comes out of our pockets for health care can vary from THCE. Resident health care costs include:
-
Premiums—a monthly amount paid for coverage under a specific insurance plan that allows you to access covered health care services; most employers that provide health insurance pay a large portion of the premium.
-
Copays/coinsurance—the amount paid for each eligible care visit or prescription medicine.
-
Deductibles—a threshold amount that a person with insurance is responsible for paying, in total across all eligible health care services (after this amount is reached, typically your insurance would pay for additional eligible care).
People also often have other costs, such as services that are not covered by insurance at all or those that are billed at higher rates than insurance will cover. While these “other costs” aren’t included in the resident health care cost calculations here, they should be considered in any discussion of affordability because they amplify the impact of rising health care costs in general.
Looking at total health care costs for private insurance from the Massachusetts resident perspective—in other words, inclusive of both premiums and cost-sharing—average statewide resident health care costs grew 6.0 percent from 2022 to 2023, almost twice as much as the benchmark.
At the same time, expenses like food and housing were also growing faster than the benchmark while wages and salaries only increased an average of 3.3 percent (because employers typically pay the majority of health insurance premiums through the same pool of compensation used for wages and salaries, future wage increases may be reduced as premiums increase).
Taken together, these trends show that the ability of Massachusetts residents to pay for health care and essential household expenses is challenging—in some cases, requiring individuals and families to make trade-offs that might impact their long-term health and well-being.
To better understand how the cost of health care in Massachusetts affects residents and businesses in concrete ways, it’s instructive to look at how individual variations in health insurance plans and health care needs impact costs, particularly in relation to total expenses.
The following profiles represent typical characteristics of health insurance subscribers in the Commonwealth, from plan type and employer size to living situation and household expenses.
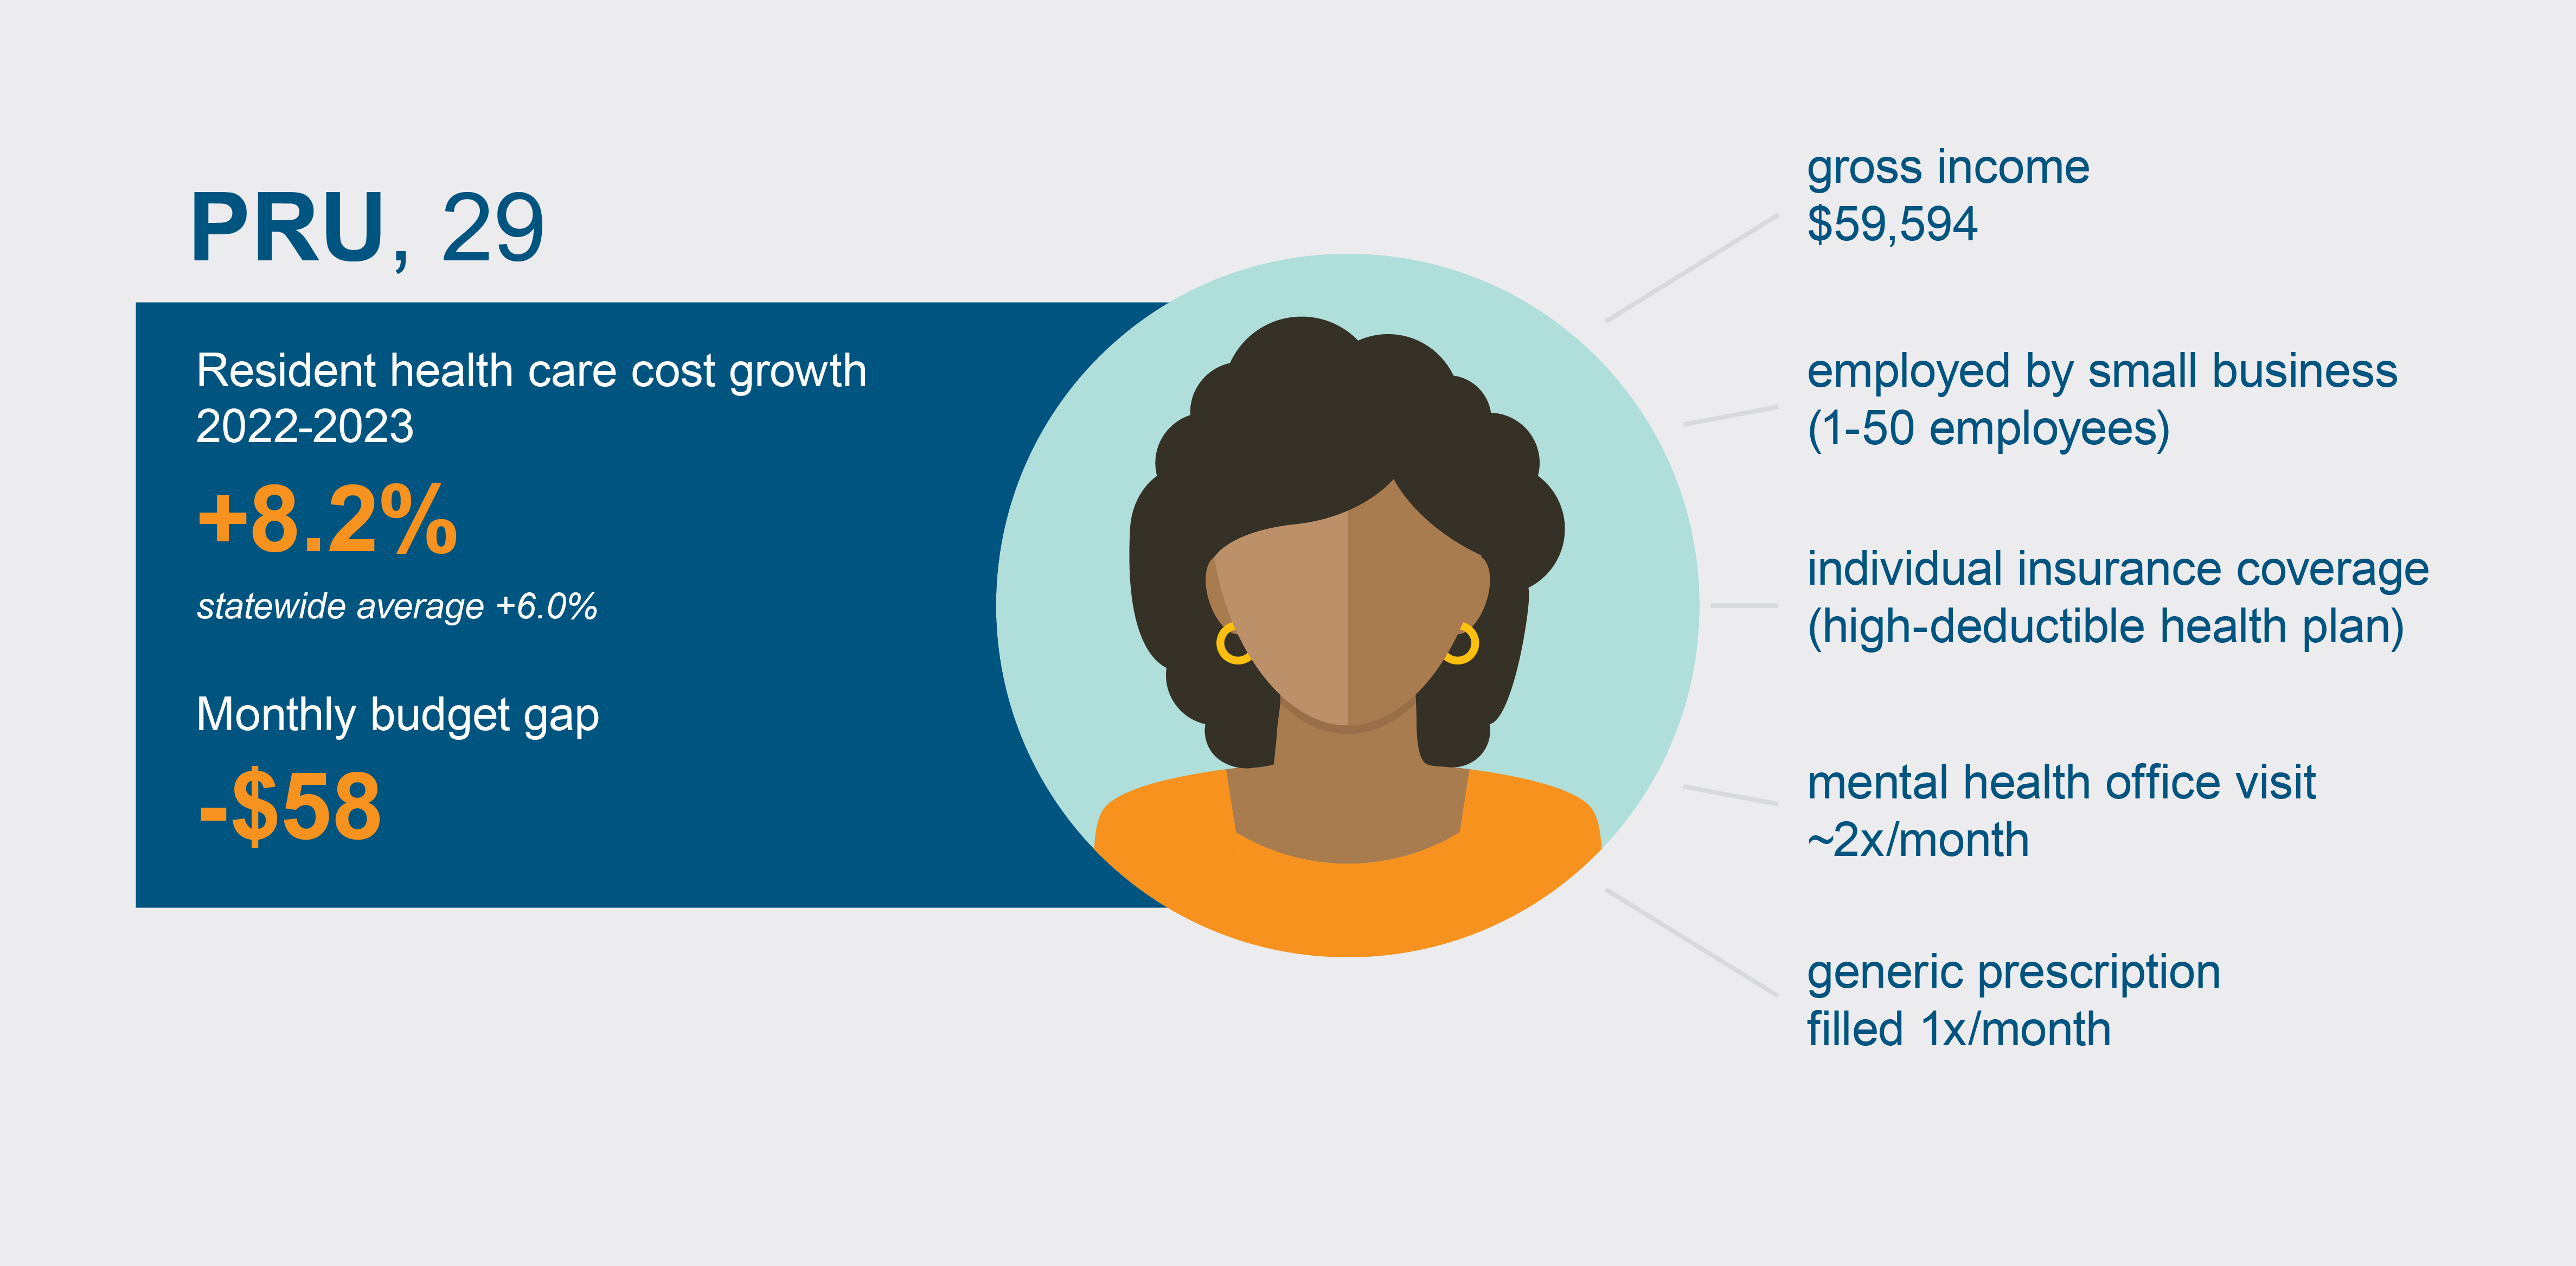
Pru, a 29-year-old college graduate, works for a small Massachusetts-based tech startup and earns about $60,000 a year. She has her own car but splits utilities with her roommate.
Pru’s employer only offers one health plan, which she has enrolled in. The plan has a low monthly premium but a high deductible of $1,500 before her insurance coverage kicks in. Besides her portion of the premium, her health care costs include an office visit with a mental health provider every 2 weeks and a generic prescription drug refill each month.
From 2022 to 2023, Pru’s health care costs increased by 8.2 percent—almost 50 percent higher than the statewide average of 6.0 percent. Adding in average taxes and household expenses, Pru runs short by more than $50 a month; to avoid overdrawing her bank account, she carries a balance on her credit card for groceries and health care visits.
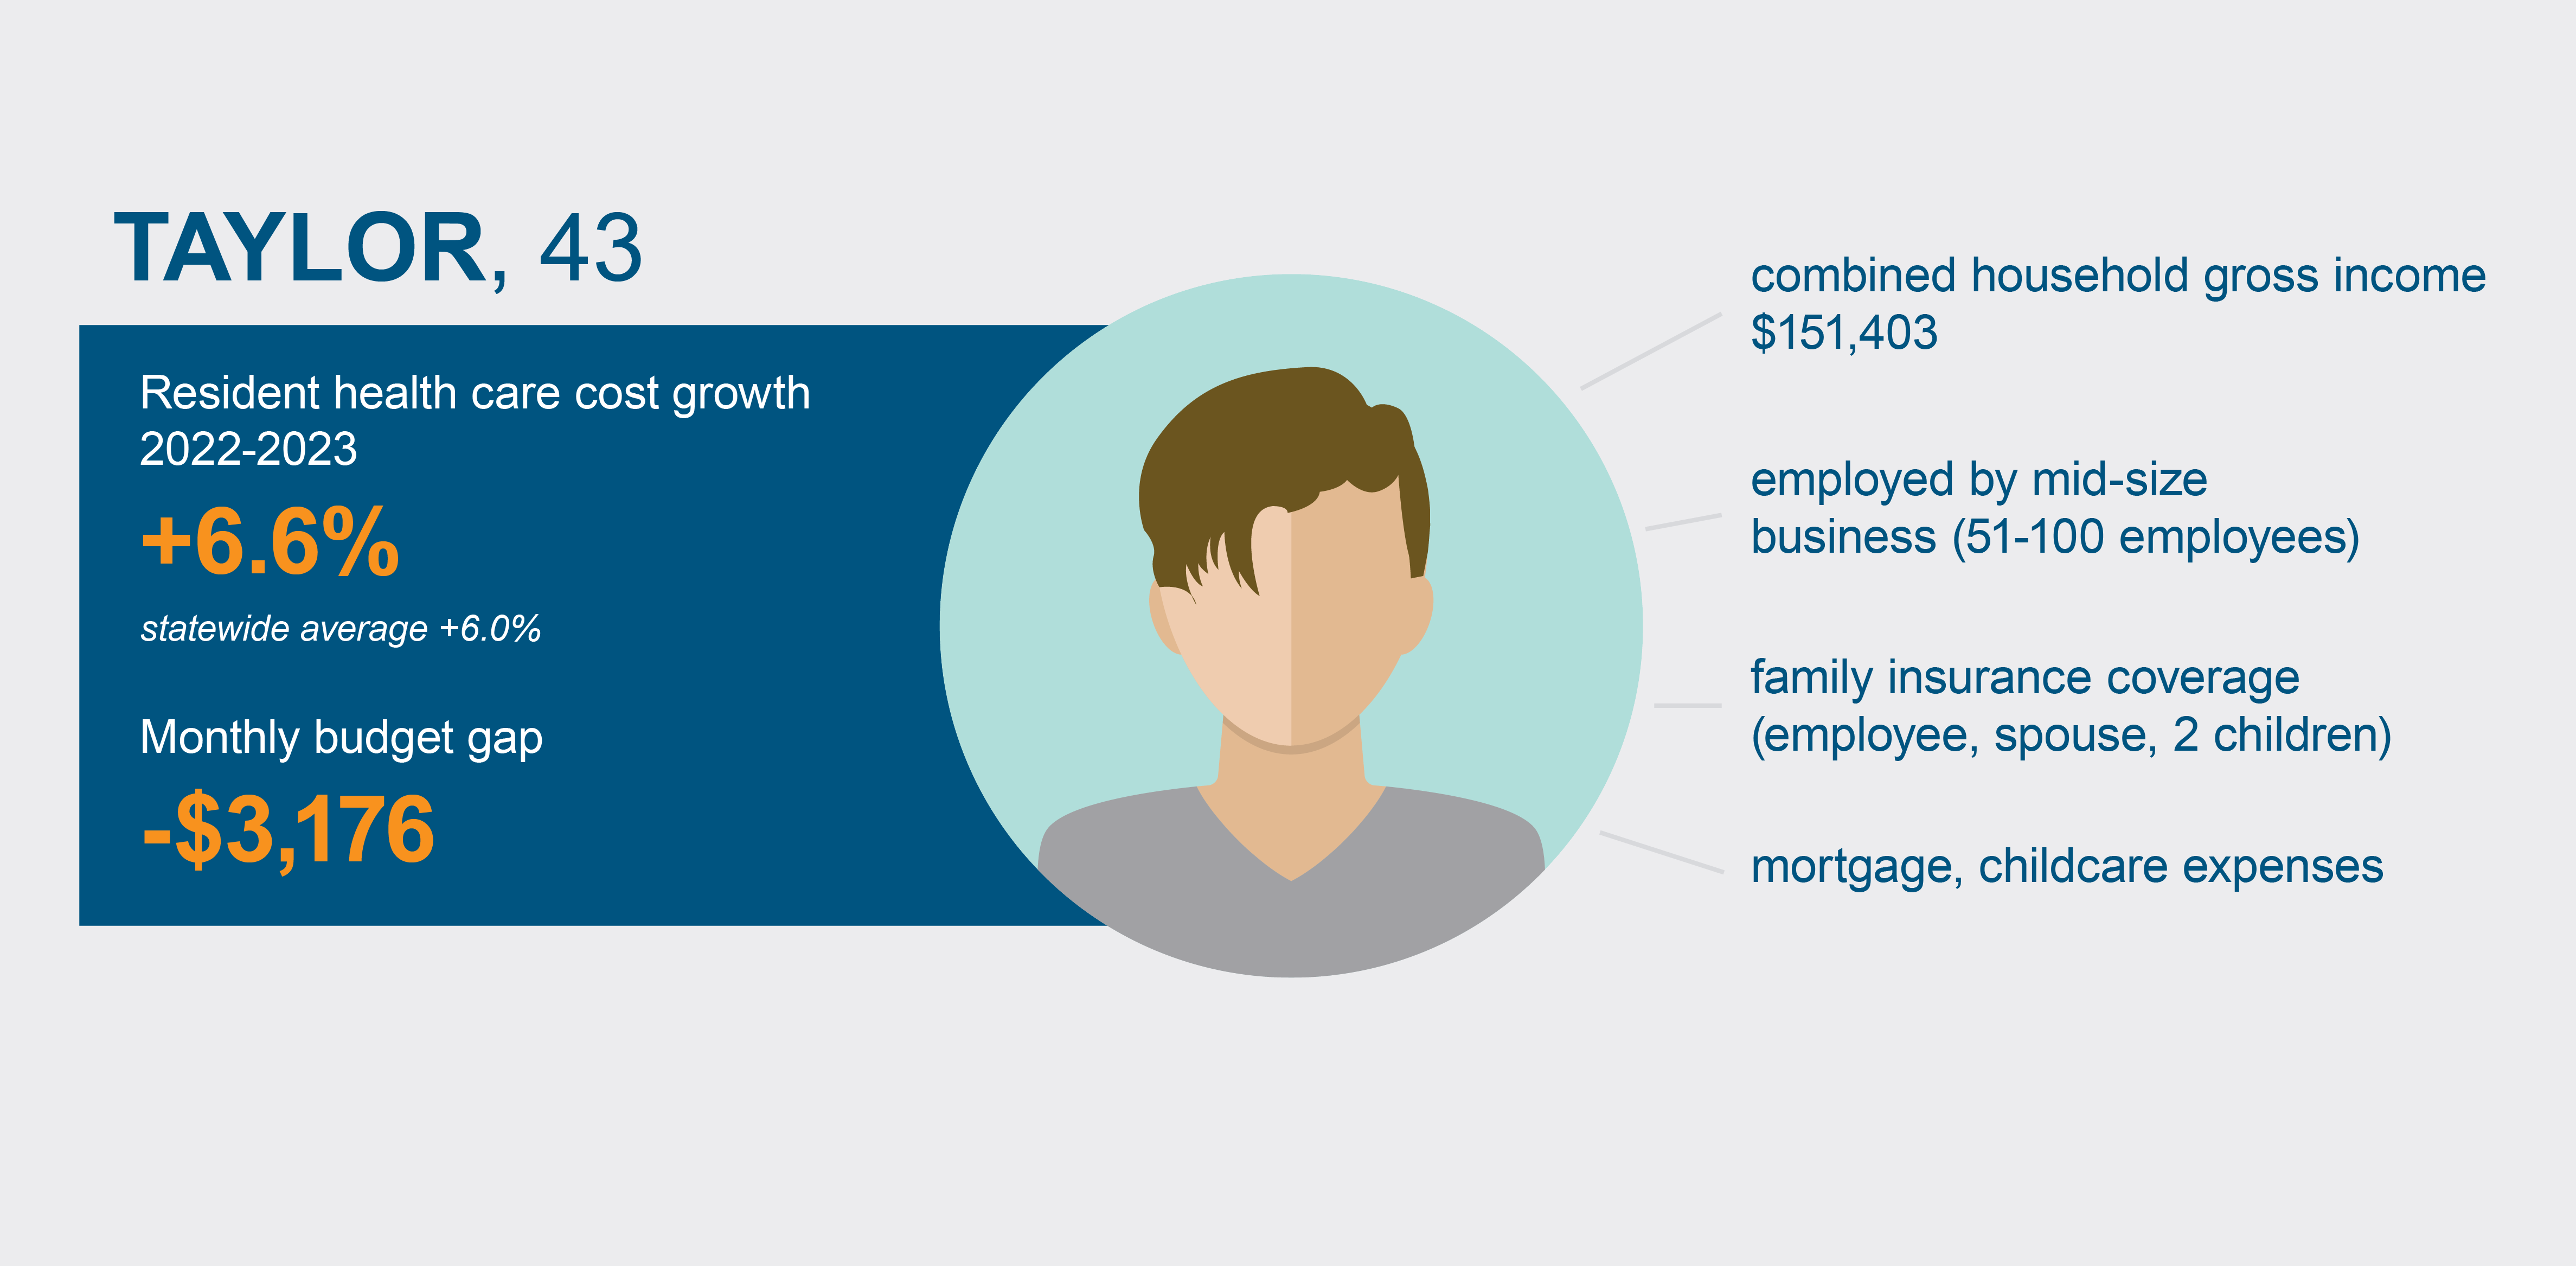
43-year-old Taylor shares a home with their spouse and two children, ages 2 and 7. Though both adults work and have a combined household income above $151,000, Taylor provides health insurance coverage for the whole family through their employer, a mid-size marketing firm with about 90 staff members.
From 2022 to 2023, health care costs for Taylor’s family grew by 6.6 percent, matching up closely with the average growth statewide. Still, their combined income doesn’t cover average expenses, including but not limited to the mortgage, childcare, and food as well as income tax and health care costs; Taylor and their partner have to budget carefully and spend less than the average family to avoid a $3,200 shortfall each month.
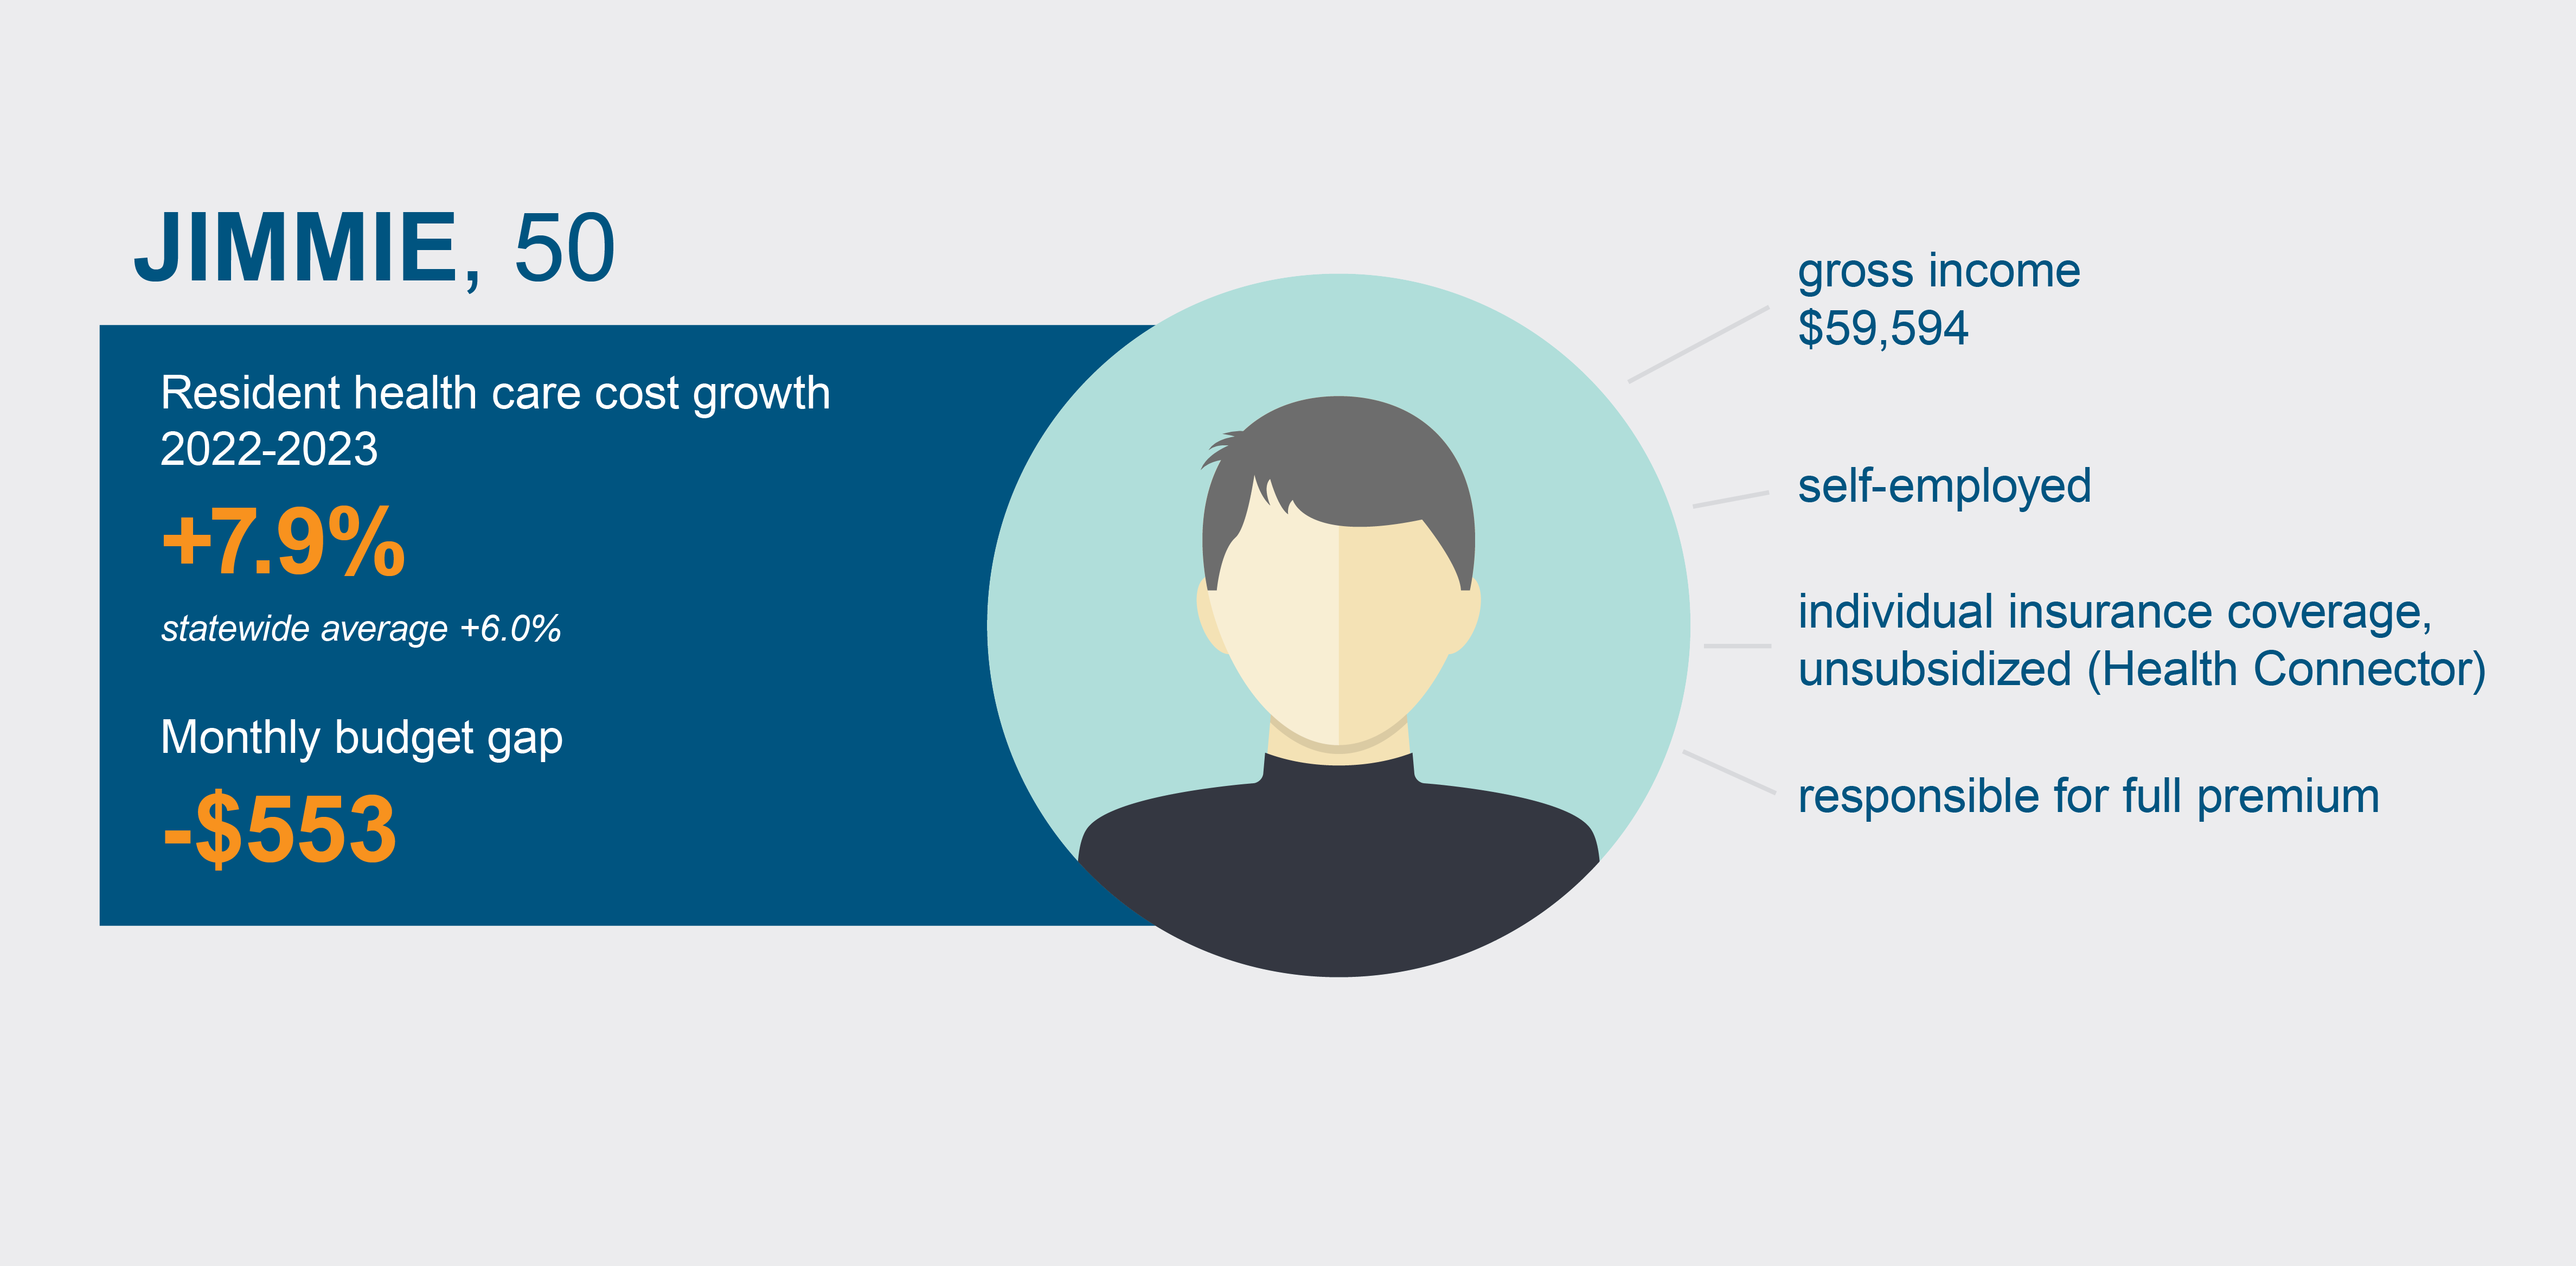
Jimmie is a 50-year-old, self-employed accountant working out of his two-bedroom rental apartment. He purchases insurance for himself through the Health Connector, the Commonwealth’s state-based health insurance marketplace—but because his income is more than 300% of the federal poverty level, he doesn’t qualify for subsidized coverage and so he pays the entire premium each month.
From 2022 to 2023, Jimmie’s health care costs increased by 7.9 percent. While proportionally that’s not as fast an increase as Pru had, health care expenses represent a much bigger part of Jimmie’s total expenses (15.4 percent vs. 6.8 percent), and in pure dollars the increase is more than twice as much as Pru’s ($50 vs. $22 more per month). With the addition of his average monthly income taxes and household expenses, he’s staring down a deficit of more than $550 each month unless he adjusts his spending budget. (More than 135,000 people—3.2 percent of all insurance subscribers in the state—purchase unsubsidized individual coverage.)
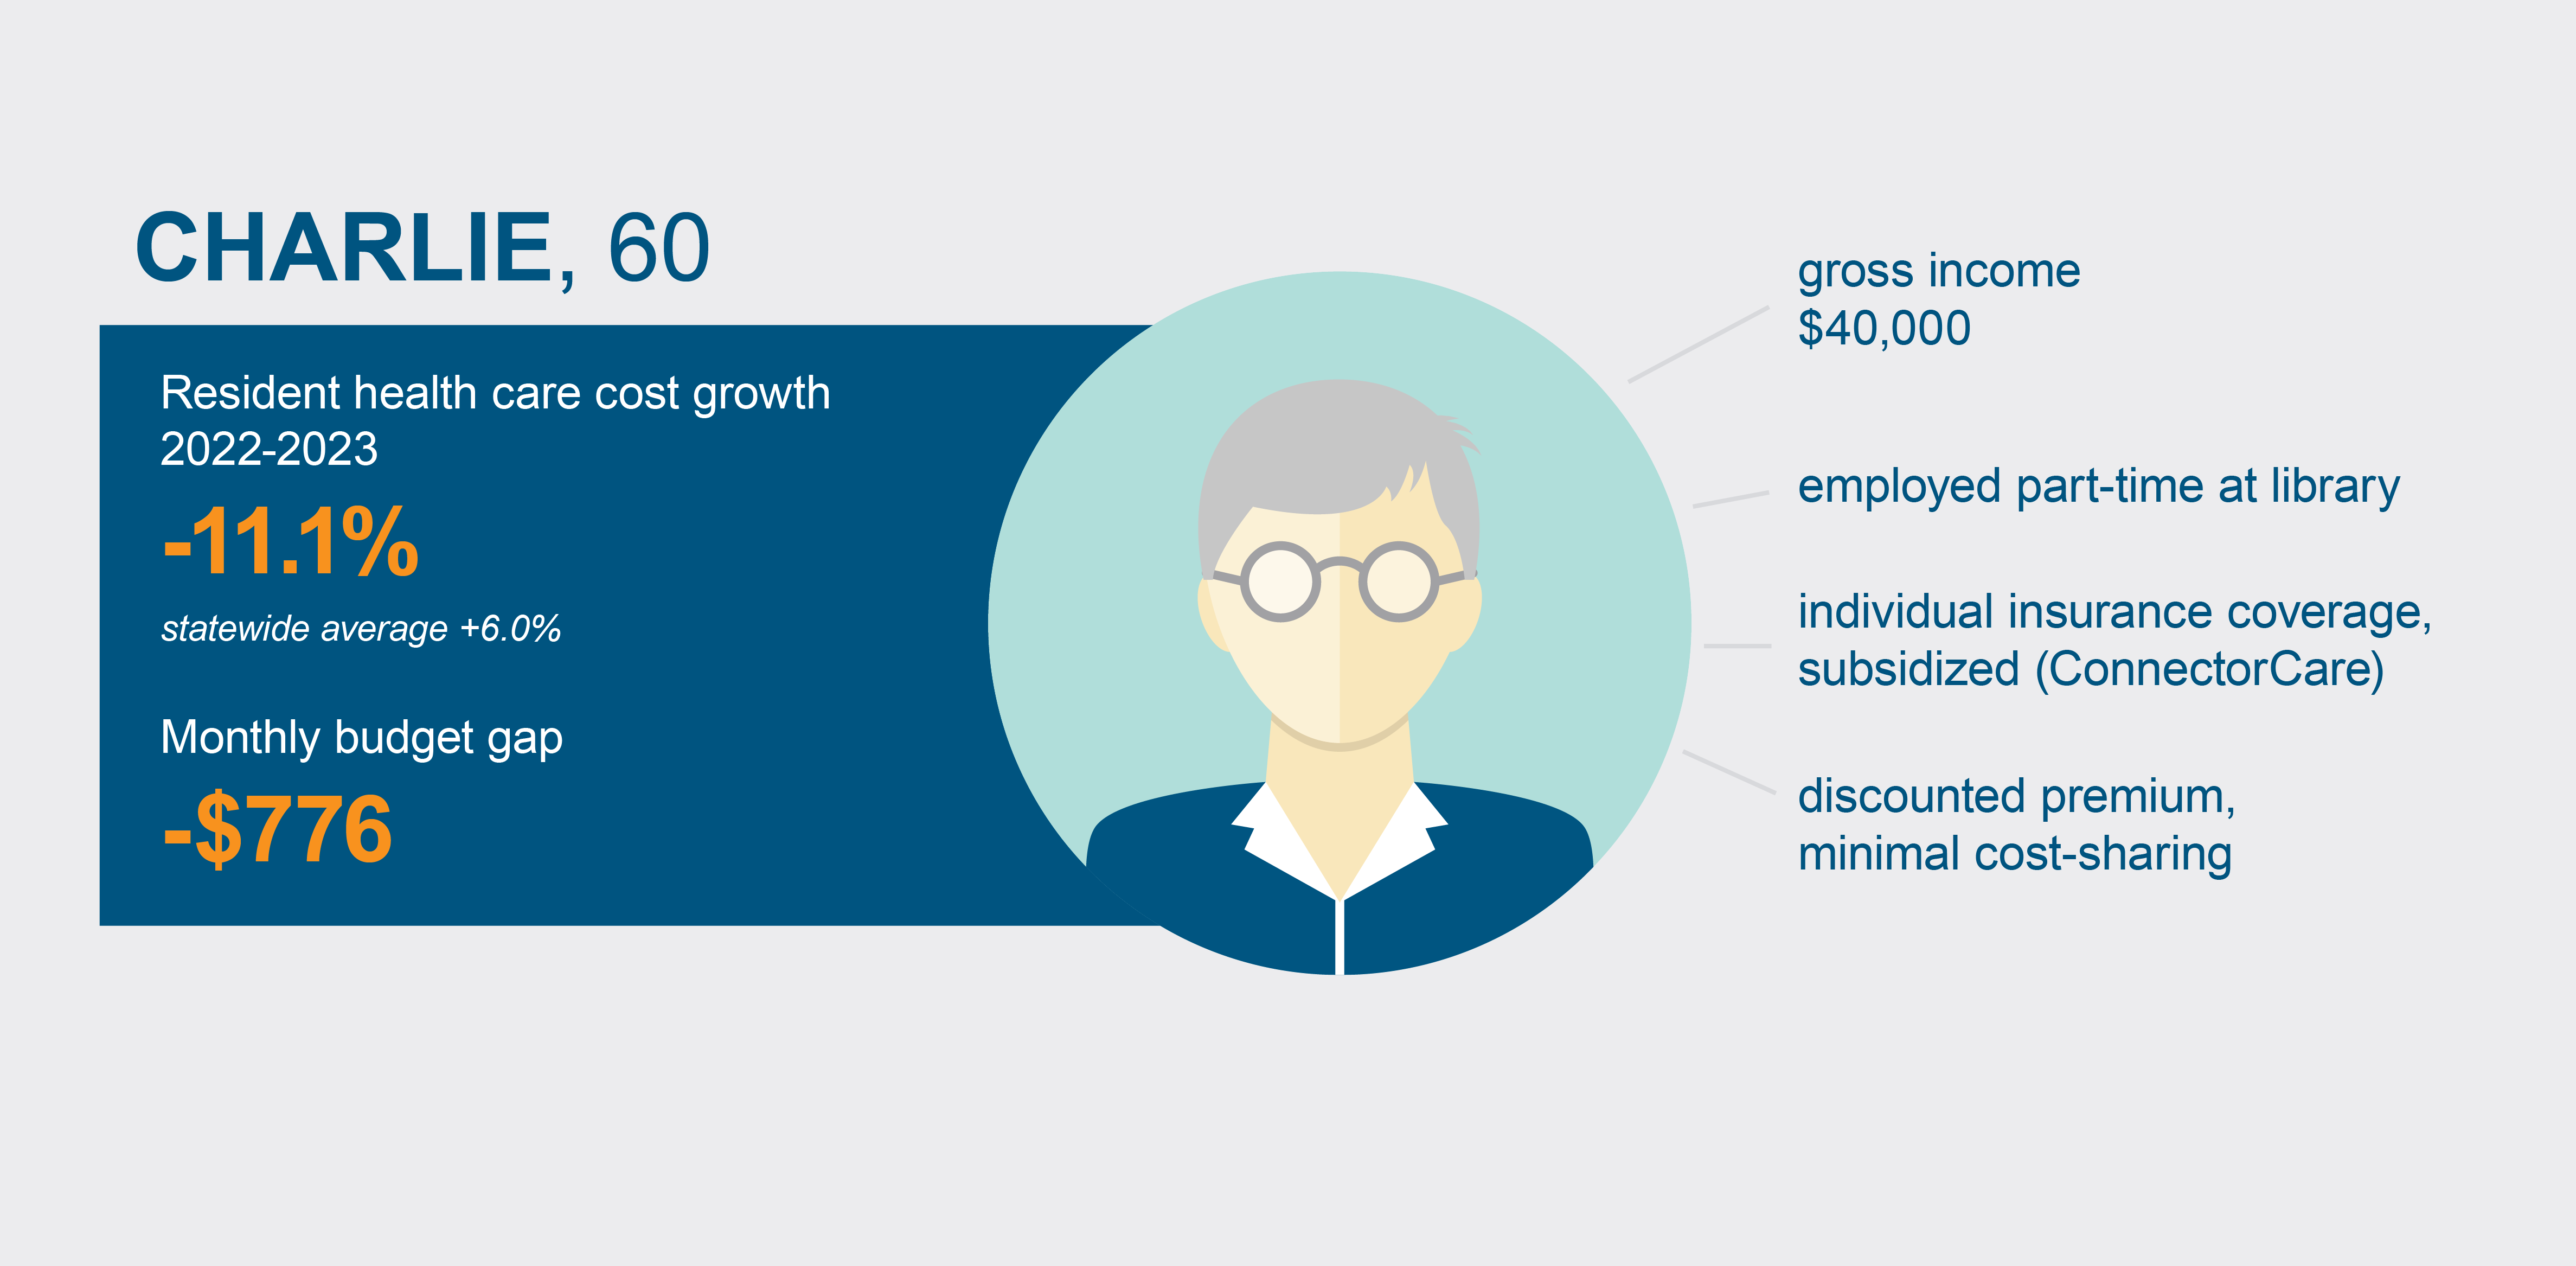
Charlie, 60, works part-time at the main library office, giving him the flexibility to manage a chronic health condition that requires specialty medication. Although he must purchase his own health insurance—which he does through the Health Connector—he qualifies for a subsidized premium of less than $140 per month because of his income level ($40,000 annually). In 2022, he also spent $20 a month for prescriptions and another $20 monthly for an office visit with his physician specialist.
In 2023, Charlie’s income increased slightly to $40,800 and he again qualified for a subsidized premium. In addition, the Health Connector eliminated prescription copays for subsidized plans. With these changes, Charlie’s overall health care costs decreased by 11.1 percent from 2022 to 2023. Despite that, he needs to close a $776 gap after accounting for other household expenses.
Employers are not immune to rising health care costs. Wicked Awesome Waterworks, a Massachusetts-based small business with 48 staff members, has been manufacturing and installing bubblers in the Commonwealth for 25 years.
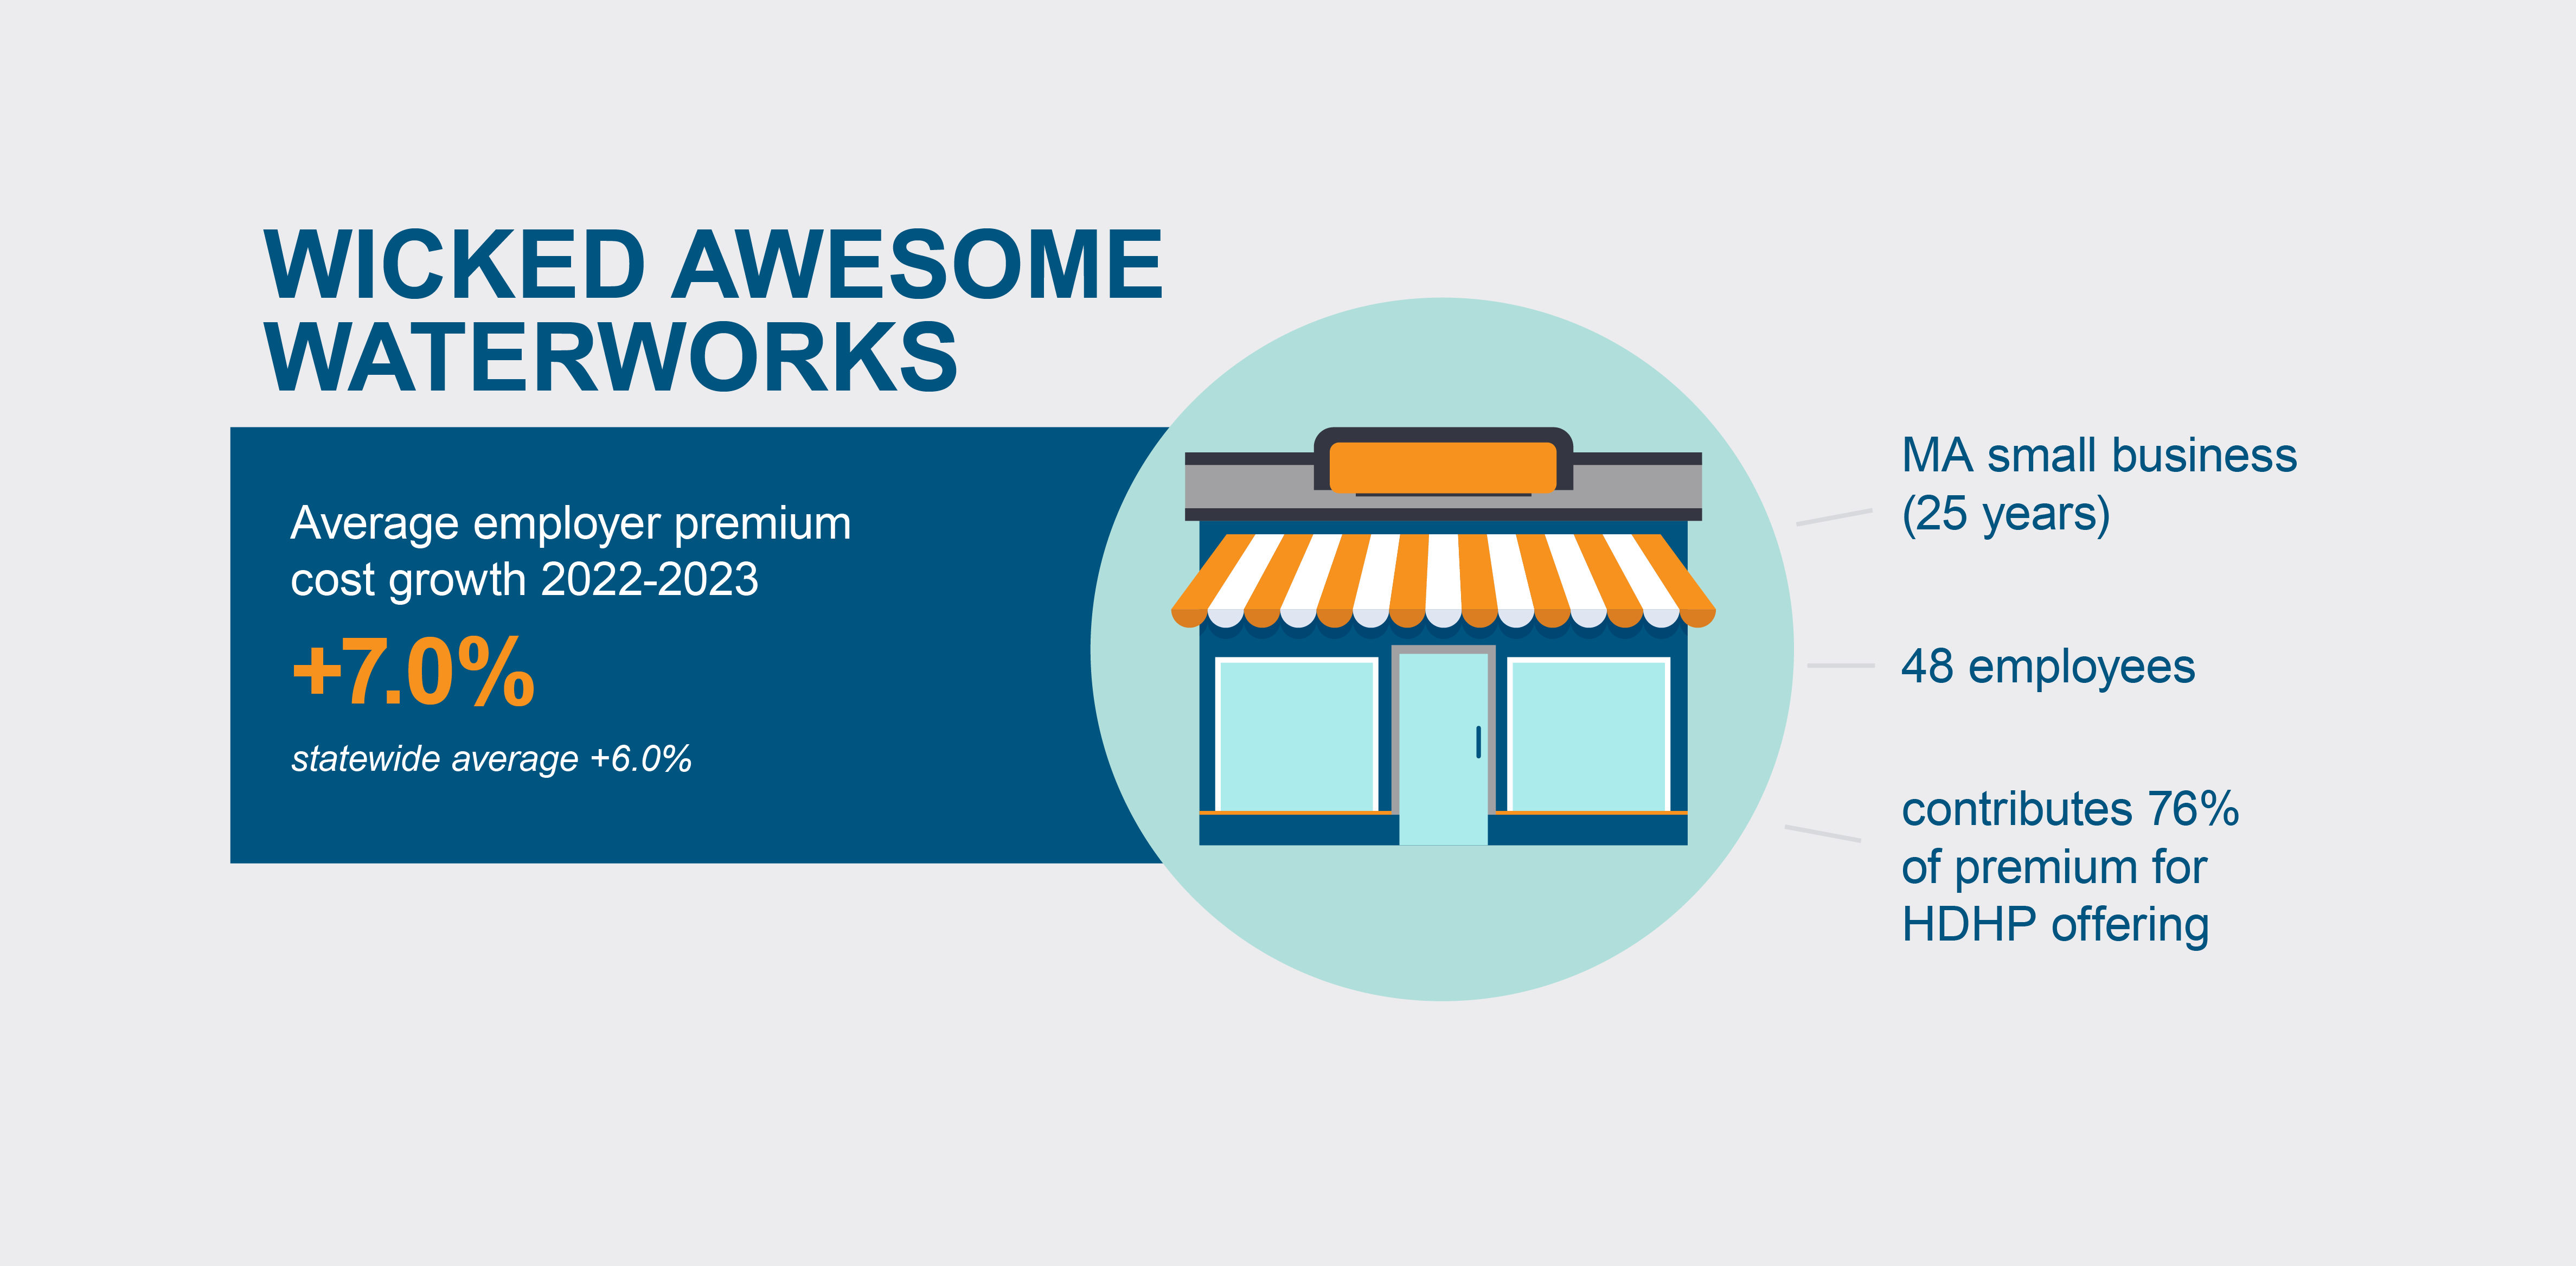
To benefit employees while managing overhead costs, Wicked Awesome offers a high-deductible health plan (HDHP) with lower monthly premiums offset by higher payment thresholds before eligible services are fully covered. It pays 76 percent of the premium and the employee is responsible for the remaining 24 percent.
From 2022 to 2023, the premium for Wicked Awesome’s HDHP increased by 7.0 percent—above both the 6.0 percent average statewide increase in employer premium payments and the 5.8% growth in Massachusetts GDP during the same period. The firm’s owners absorbed this additional expense by capping staff salary increases at 1.5 percent rather than changing the premium percentage paid by employees.
As these profiles show, to accurately evaluate the impact of rising health care costs in the Commonwealth, analysis needs to go beyond top-level averages to reveal the varied circumstances of individuals, families, and businesses: Premium levels shift if your health insurance is purchased through an employer who covers part of the cost or if you purchase coverage for multiple people in the household. The price for health care services, such as copays and deductibles, can differ based on whether you’re seeing a primary care provider or a specialist or if you have a chronic condition that requires more frequent office visits. Access to reliable transportation, high-quality food sources, and other socioeconomic factors play a part, as well.
To succeed, policy solutions for the persistent health care affordability challenges in Massachusetts will similarly require attention to these distinct circumstances rather than taking a one-size-fits-all approach.
For more on THCE and other year-over-year trends, read CHIA’s latest Annual Report on the Performance of the Massachusetts Health Care System.

Sources
Annual Report on the Performance of the Massachusetts Health Care System, March 2025
2024 Massachusetts Employer Survey
2023 Massachusetts Health Insurance Survey
Massachusetts Health Connector
U.S. Census Bureau: Massachusetts Data Profile
ADP Massachusetts Paycheck Calculator
MIT Living Wage Calculator: Living Wage Calculation for Massachusetts
Rocket Mortgage Average Mortgage Payments by State
U.S. Bureau of Labor Statistics: Consumer Expenditure Surveys